To show graphically that net force and acceleration are linearly related and that force may be defined as mass x acceleration. (Display using podium.)
Location
Room 136, shelf M4 (dynamics track-wall shelf U4)
Description
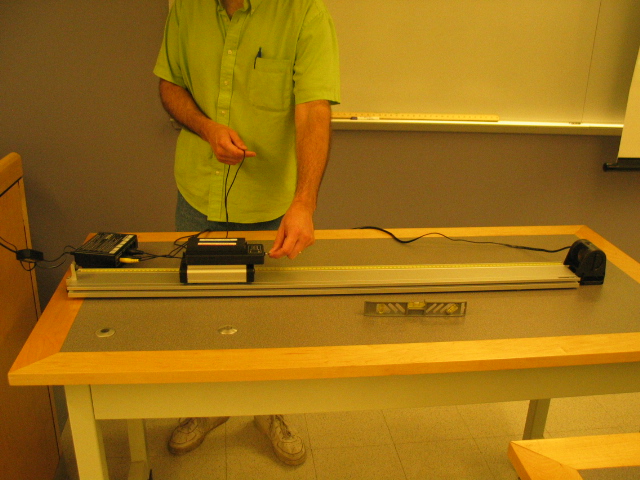
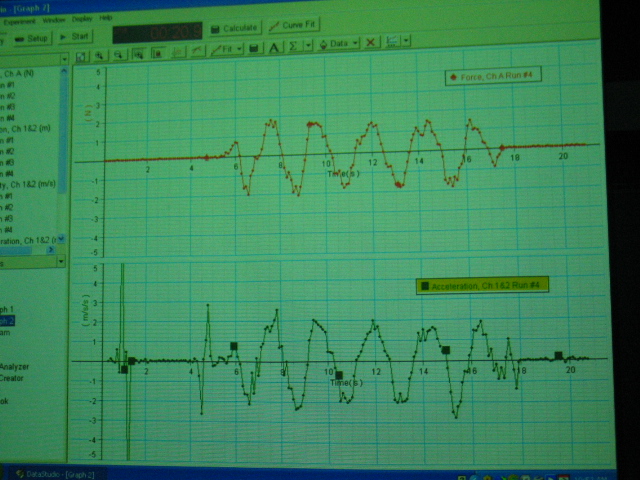
Use a force sensor on a dynamics cart and a motion sensor (top left) to plot force and acceleration vs. time on aligned DataStudio graphs. Use the eye bolt on the force sensor to accelerate the cart back and forth on the track several times. Then drag the acceleration data from the Summary panel on the left of the screen to the force vs. time graph. Right click and select Align. The correlation between these two plots should be apparent if data is good (top right).
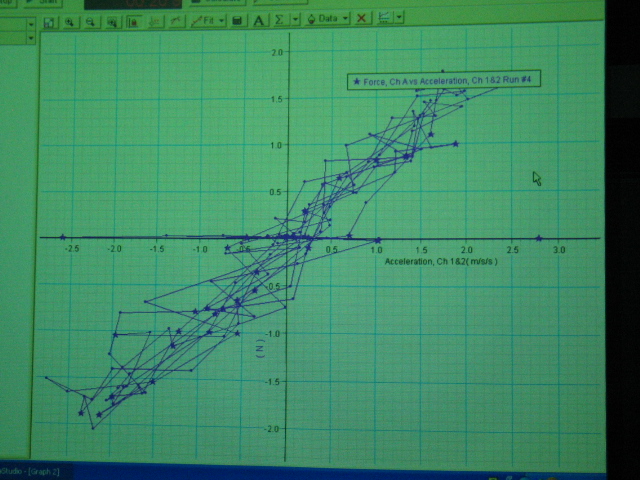
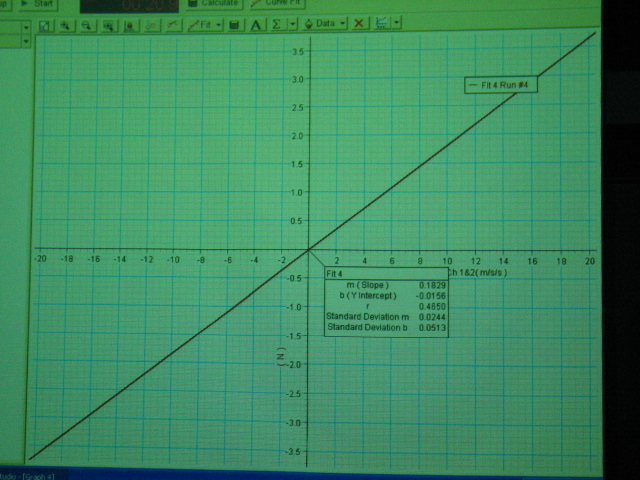
Next, make a force vs. acceleration graph by displaying a force vs. time graph and dragging acceleration data from the Summary panel to the time axis label. (bottom left). Fit a straight line to this graph to show that these quantities are well correlated (i.e. r close to 1). Note the slope of the line (bottom right). Add (or remove) a black, steel mass and repeat the above to show that the slope changes. Again note the slope of the line. Compare the total mass accelerated to the slope in each case.