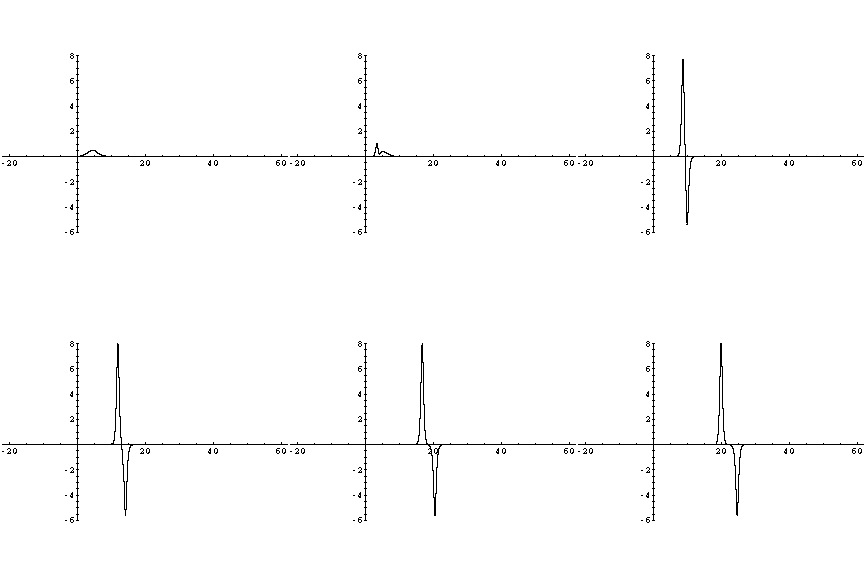
time steps: t=-1,-0.9,-0.8,...,2
Eigenvalues: k1=2, k2=1, k3=1/2
Phase shifts: c1=2, c2=1, c3=1/2
u=u1+u2+u3 (decay decomposition)
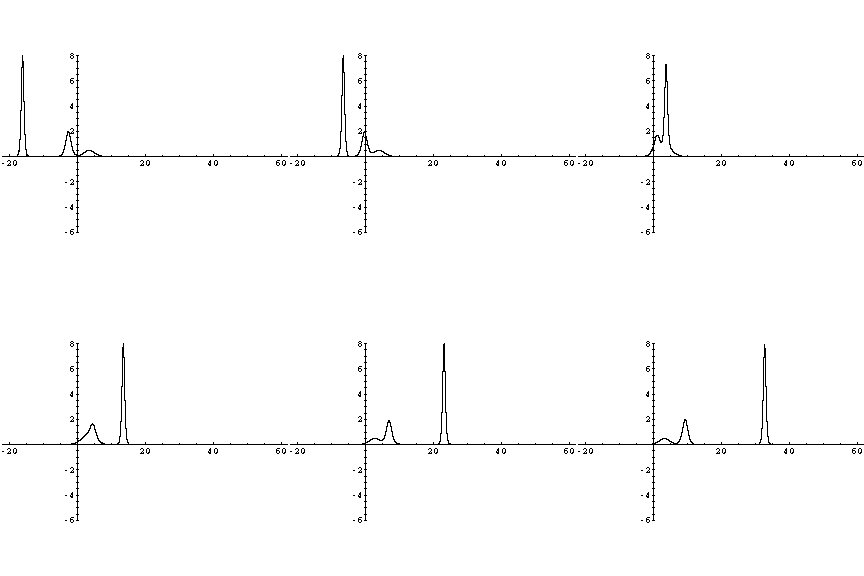
I. Here is the graph of -u(x,t) versus x:
time steps: t=-1,-0.9,-0.8,...,2

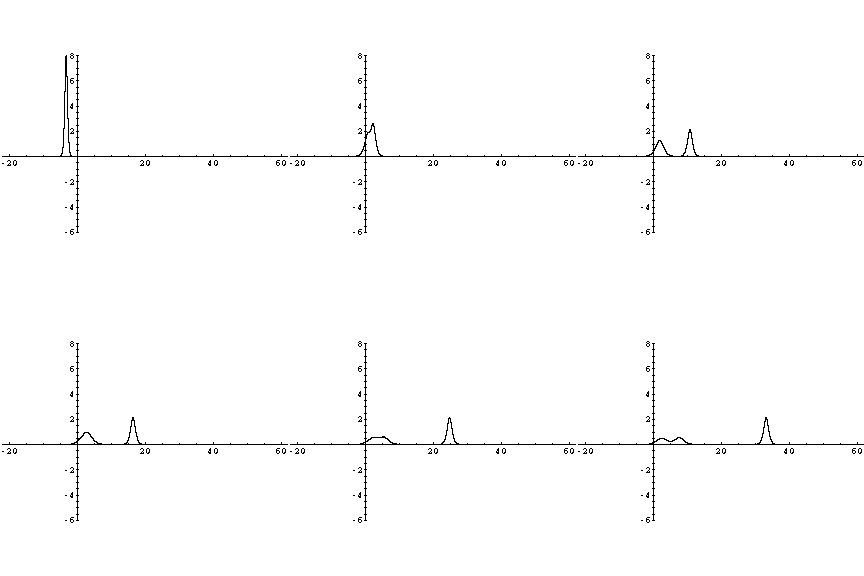
II. Here is the first decay function -u1(x,t) (of the tallest particle
s1) for comparison:
time steps: t=-0.2,-0.1,0,...,1.2 (Note that time steps are out of
synch with u(x,t))
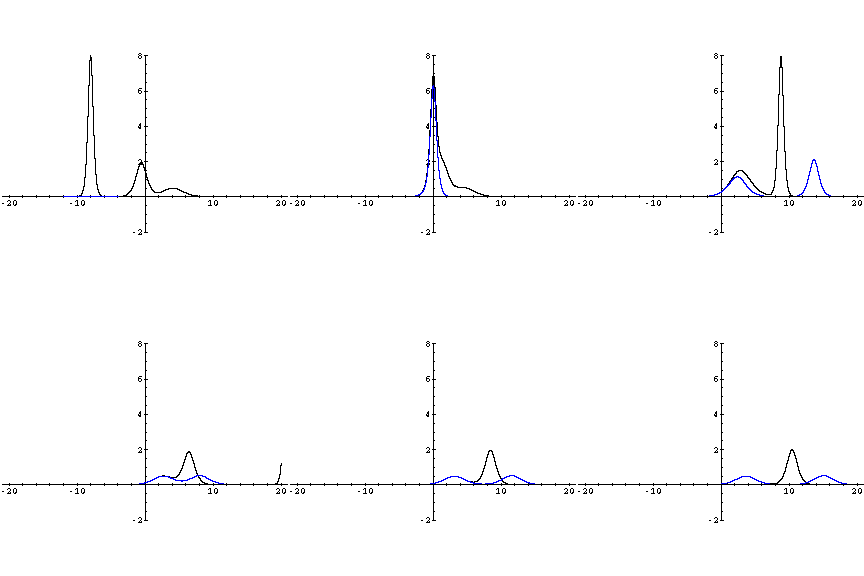
III. Here is the first decay function -u1(x,t) (in blue) plotted together
with -u(x,t) (in black):
time steps: t=-0.5, -0.25, ..., 2.25.
IV. Here is the second decay function -u2(x,t) (of the middle particle
s2) for comparison:
t=0,0.1,0.2,...,1.2
(Note that the tallest peak in the graph fades in the last couple of
frames due to computational difficulties outside of the time interval [0,1])
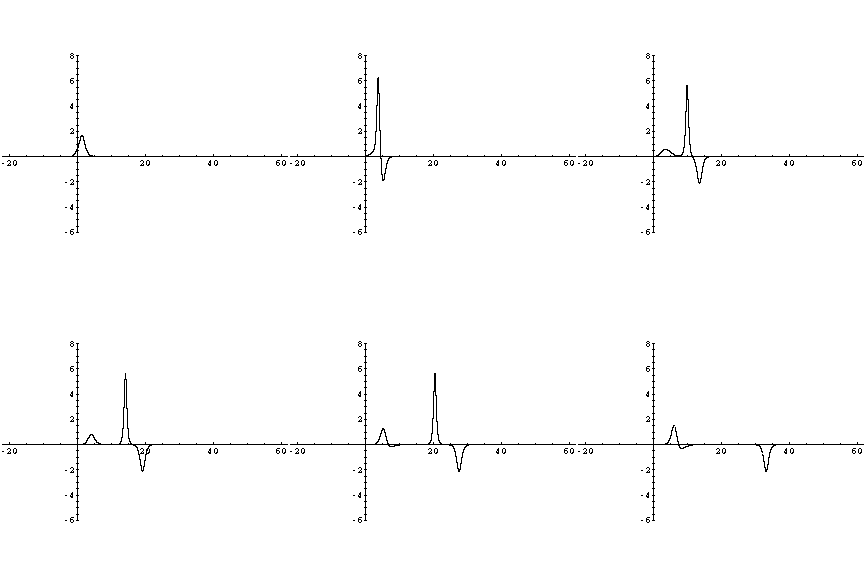
V. Here is the third decay function -u3(x,t) (of the shortest particle
s3) for comparison:
t=0,0.1,0.2,...,1.2
