Wavelet Tutorial - Part 1
by Robi Polikar
Fundamental Concepts and an Overview of the Wavelet Theory
Welcome to this introductory tutorial on wavelet transforms. The wavelet transform is a relatively new concept (about 10 years old), but yet there are quite a few articles and books written on them. However, most of these books and articles are written by math people, for the other math people; still most of the math people don't know what the other math people are talking about (a math professor of mine made this confession). In other words, majority of the literature available on wavelet transforms are of little help, if any, to those who are new to this subject (this is my personal opinion).
When I first started working on wavelet transforms I have struggled for many hours and days to figure out what was going on in this mysterious world of wavelet transforms, due to the lack of introductory level text(s) in this subject. Therefore, I have decided to write this tutorial for the ones who are new to the this topic. I consider myself quite new to the subject too, and I have to confess that I have not figured out all the theoretical details yet. However, as far as the engineering applications are concerned, I think all the theoretical details are not necessarily necessary (!).
In this tutorial I will try to give basic principles underlying the wavelet theory. The proofs of the theorems and related equations will not be given in this tutorial due to the simple assumption that the intended readers of this tutorial do not need them at this time. However, interested readers will be directed to related references for further and in-depth information.
In this document I am assuming that you have no background knowledge, whatsoever. If you do have this background, please disregard the following information, since it may be trivial.
Should you find any inconsistent, or incorrect information in the following tutorial, please feel free to contact me. I will appreciate any comments on this page.
Robi Polikar
TRANS... WHAT?
First of all, why do we need a transform, or what is a transform anyway?
Mathematical transformations are applied to signals to obtain a further information from that signal that is not readily available in the raw signal. In the following tutorial I will assume a time-domain signal as a raw signal, and a signal that has been "transformed" by any of the available mathematical transformations as a processed signal.
There are number of transformations that can be applied, among which the Fourier transforms are probably by far the most popular.
Most of the signals in practice, are TIME-DOMAIN signals in their raw format. That is, whatever that signal is measuring, is a function of time. In other words, when we plot the signal one of the axes is time (independent variable), and the other (dependent variable) is usually the amplitude. When we plot time-domain signals, we obtain a time-amplitude representation of the signal. This representation is not always the best representation of the signal for most signal processing related applications. In many cases, the most distinguished information is hidden in the frequency content of the signal. The frequency SPECTRUM of a signal is basically the frequency components (spectral components) of that signal. The frequency spectrum of a signal shows what frequencies exist in the signal.
Intuitively, we all know that the frequency is something to do with the change in rate of something. If something ( a mathematical or physical variable, would be the technically correct term) changes rapidly, we say that it is of high frequency, where as if this variable does not change rapidly, i.e., it changes smoothly, we say that it is of low frequency. If this variable does not change at all, then we say it has zero frequency, or no frequency. For example the publication frequency of a daily newspaper is higher than that of a monthly magazine (it is published more frequently).
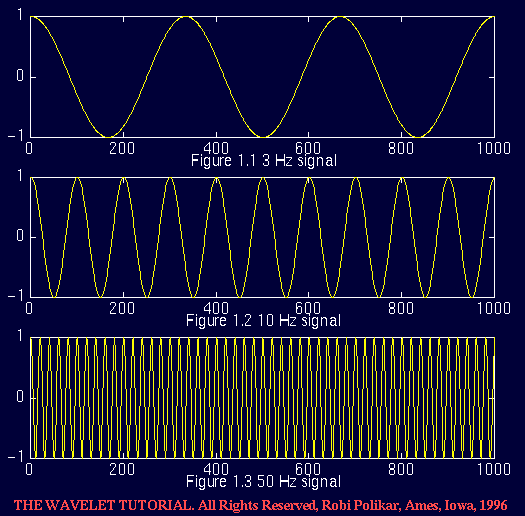
The frequency is measured in cycles/second, or with a more common name, in "Hertz". For example the electric power we use in our daily life in the US is 60 Hz (50 Hz elsewhere in the world). This means that if you try to plot the electric current, it will be a sine wave passing through the same point 50 times in 1 second. Now, look at the following figures. The first one is a sine wave at 3 Hz, the second one at 10 Hz, and the third one at 50 Hz. Compare them.
So how do we measure frequency, or how do we find the frequency content of a signal? The answer is FOURIER TRANSFORM (FT). If the FT of a signal in time domain is taken, the frequency-amplitude representation of that signal is obtained. In other words, we now have a plot with one axis being the frequency and the other being the amplitude. This plot tells us how much of each frequency exists in our signal.
The frequency axis starts from zero, and goes up to infinity. For every frequency, we have an amplitude value. For example, if we take the FT of the electric current that we use in our houses, we will have one spike at 50 Hz, and nothing elsewhere, since that signal has only 50 Hz frequency component. No other signal, however, has a FT which is this simple. For most practical purposes, signals contain more than one frequency component. The following shows the FT of the 50 Hz signal:
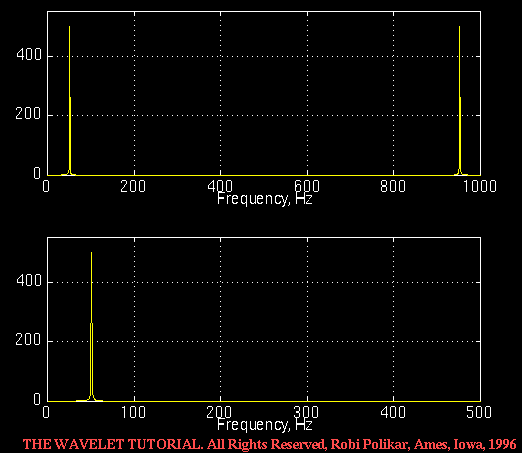
Figure 1.4 The FT of the 50 Hz signal given in Figure 1.3
One word of caution is in order at this point. Note that two plots are given in Figure 1.4. The bottom one plots only the first half of the top one. Due to reasons that are not crucial to know at this time, the frequency spectrum of a real valued signal is always symmetric. The top plot illustrates this point. However, since the symmetric part is exactly a mirror image of the first part, it provides no additional information, and therefore, this symmetric second part is usually not shown. In most of the following figures corresponding to FT, I will only show the first half of this symmetric spectrum.
Why do we need the frequency information?
Often times, the information that cannot be readily seen in the time-domain can be seen in the frequency domain.
Let's give an example from biological signals. Suppose we are looking at an ECG signal (ElectroCardioGraphy, graphical recording of heart's electrical activity). The typical shape of a healthy ECG signal is well known to cardiologists. Any significant deviation from that shape is usually considered to be a symptom of a pathological condition.
This pathological condition, however, may not always be quite obvious in the original time-domain signal. Cardiologists usually use the time-domain ECG signals which are recorded on strip-charts to analyze ECG signals. Recently, the new computerized ECG recorders/analyzers also utilize the frequency information to decide whether a pathological condition exists. A pathological condition can sometimes be diagnosed more easily when the frequency content of the signal is analyzed.
This, of course, is only one simple example why frequency content might be useful. Today Fourier transforms are used in many different areas including all branches of engineering.
Although FT is probably the most popular transform being used (especially in electrical engineering), it is not the only one. There are many other transforms that are used quite often by engineers and mathematicians. Hilbert transform, short-time Fourier transform (more about this later), Wigner distributions, the Radon Transform, and of course our featured transformation, the wavelet transform, constitute only a small portion of a huge list of transforms that are available at engineer's and mathematician's disposal. Every transformation technique has its own area of application, with advantages and disadvantages, and the wavelet transform (WT) is no exception.
For a better understanding of the need for the WT let's look at the FT more closely. FT (as well as WT) is a reversible transform, that is, it allows to go back and forward between the raw and processed (transformed) signals. However, only either of them is available at any given time. That is, no frequency information is available in the time-domain signal, and no time information is available in the Fourier transformed signal. The natural question that comes to mind is that is it necessary to have both the time and the frequency information at the same time?
As we will see soon, the answer depends on the particular application, and the nature of the signal in hand. Recall that the FT gives the frequency information of the signal, which means that it tells us how much of each frequency exists in the signal, but it does not tell us when in time these frequency components exist. This information is not required when the signal is so-called stationary.
Let's take a closer look at this stationarity concept more closely, since it is of paramount importance in signal analysis. Signals whose frequency content do not change in time are called stationary signals. In other words, the frequency content of stationary signals do not change in time. In this case, one does not need to know at what times frequency components exist, since all frequency components exist at all times!!!
For example the following signal
$x(t) = cos(2 \pi \cdot 10 t) + cos(2 \pi \cdot 25 t) + cos(2 \pi \cdot 50 t) + cos(2 \pi \cdot 100 t)$
is a stationary signal, because it has frequencies of 10, 25, 50, and 100 Hz at any given time instant. This signal is plotted below:
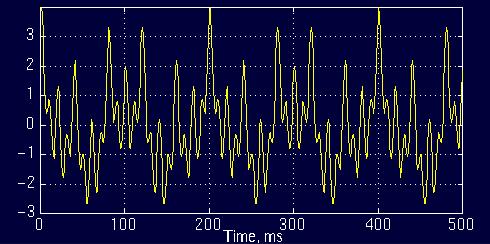
Figure 1.5
And the following is its FT:
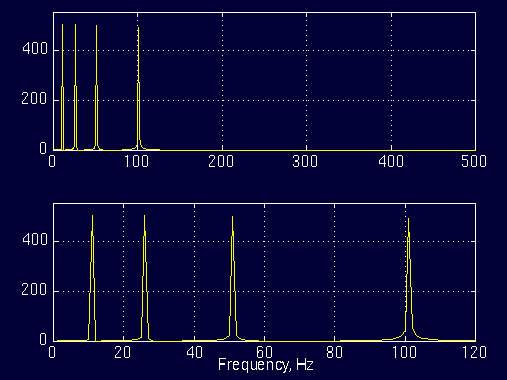
Figure 1.6
The top plot in Figure 1.6 is the (half of the symmetric) frequency spectrum of the signal in Figure 1.5. The bottom plot is the zoomed version of the top plot, showing only the range of frequencies that are of interest to us. Note the four spectral components corresponding to the frequencies 10, 25, 50 and 100 Hz.
Contrary to the signal in Figure 1.5, the following signal is not stationary. Figure 1.7 plots a signal whose frequency constantly changes in time. This signal is known as the "chirp" signal. This is a non-stationary signal.
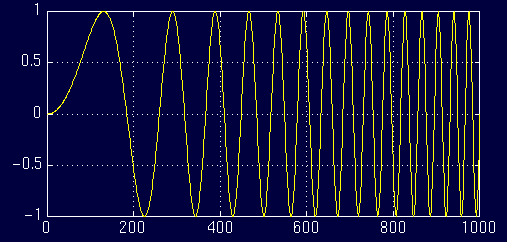
Figure 1.7
Let's look at another example. Figure 1.8 plots a signal with four different frequency components at four different time intervals, hence a non-stationary signal. The interval 0 to 300 ms has a 100 Hz sinusoid, the interval 300 to 600 ms has a 50 Hz sinusoid, the interval 600 to 800 ms has a 25 Hz sinusoid, and finally the interval 800 to 1000 ms has a 10 Hz sinusoid.
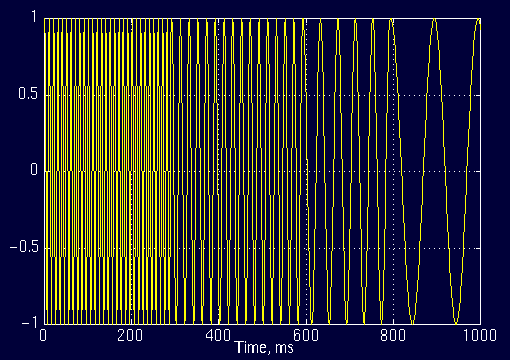
Figure 1.8
And the following is its FT:
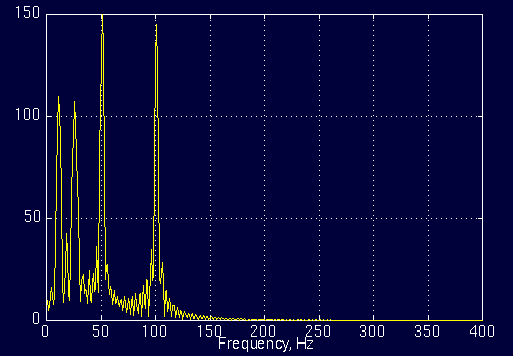
Figure 1.9
Do not worry about the little ripples at this time; they are due to sudden changes from one frequency component to another, which have no significance in this text. Note that the amplitudes of higher frequency components are higher than those of the lower frequency ones. This is due to fact that higher frequencies last longer (300 ms each) than the lower frequency components (200 ms each). (The exact value of the amplitudes are not important).
Other than those ripples, everything seems to be right. The FT has four peaks, corresponding to four frequencies with reasonable amplitudes... Right?
WRONG (!)
Well, not exactly wrong, but not exactly right either... Here is why:
For the first signal, plotted in Figure 1.5, consider the following question:
At what times (or time intervals), do these frequency components occur?
Answer:
At all times! Remember that in stationary signals, all frequency components that exist in the signal, exist throughout the entire duration of the signal. There is 10 Hz at all times, there is 50 Hz at all times, and there is 100 Hz at all times.
Now, consider the same question for the non-stationary signal in Figure 1.7 or in Figure 1.8.
For the signal in Figure 1.8, we know that in the first interval we have the highest frequency component, and in the last interval we have the lowest frequency component. For the signal in Figure 1.7, the frequency components change continuously. Therefore, for these signals the frequency components do not appear at all times!
Now, compare the Figures 1.6 and 1.9. The similarity between these two spectrum should be apparent. Both of them show four spectral components at exactly the same frequencies, i.e., at 10, 25, 50, and 100 Hz. Other than the ripples, and the difference in amplitude (which can always be normalized), the two spectrums are almost identical, although the corresponding time-domain signals are not even close to each other. Both of the signals involves the same frequency components, but the first one has these frequencies at all times, the second one has these frequencies at different intervals. So, how come the spectrums of two entirely different signals look very much alike? Recall that the FT gives the spectral content of the signal, but it gives no information regarding where in time those spectral components appear. Therefore, FT is not a suitable technique for non-stationary signal, with one exception:
FT can be used for non-stationary signals, if we are only interested in what spectral components exist in the signal, but not interested where these occur. However, if this information is needed, i.e., if we want to know, what spectral component occur at what time (interval) , then Fourier transform is not the right transform to use.
For practical purposes it is difficult to make the separation, since there are a lot of practical stationary signals, as well as non-stationary ones. Almost all biological signals, for example, are non-stationary. Some of the most famous ones are ECG (electrical activity of the heart , electrocardiograph), EEG (electrical activity of the brain, electroencephalograph), and EMG (electrical activity of the muscles, electromyogram).
Once again please note that, the FT gives what frequency components (spectral components) exist in the signal. Nothing more, nothing less.
When the time localization of the spectral components are needed, a transform giving the TIME-FREQUENCY REPRESENTATION of the signal is needed.
The Ultimate Solution: The Wavelet Transform
The Wavelet transform is a transform of this type. It provides the time-frequency representation. (There are other transforms which give this information too, such as short time Fourier transform, Wigner distributions, etc.)
Often times a particular spectral component occurring at any instant can be of particular interest. In these cases it may be very beneficial to know the time intervals these particular spectral components occur. For example, in EEGs, the latency of an event-related potential is of particular interest (Event-related potential is the response of the brain to a specific stimulus like flash-light, the latency of this response is the amount of time elapsed between the onset of the stimulus and the response).
Wavelet transform is capable of providing the time and frequency information simultaneously, hence giving a time-frequency representation of the signal.
How wavelet transform works is completely a different fun story, and should be explained after short time Fourier Transform (STFT). The WT was developed as an alternative to the STFT. The STFT will be explained in great detail in the second part of this tutorial. It suffices at this time to say that the WT was developed to overcome some resolution related problems of the STFT, as explained in Part II.
To make a real long story short, we pass the time-domain signal from various highpass and low pass filters, which filters out either high frequency or low frequency portions of the signal. This procedure is repeated, every time some portion of the signal corresponding to some frequencies being removed from the signal.
Here is how this works: Suppose we have a signal which has frequencies up to 1000 Hz. In the first stage we split up the signal in to two parts by passing the signal from a highpass and a lowpass filter (filters should satisfy some certain conditions, so-called admissibility condition) which results in two different versions of the same signal: portion of the signal corresponding to 0-500 Hz (low pass portion), and 500-1000 Hz (high pass portion).
Then, we take either portion (usually low pass portion) or both, and do the same thing again. This operation is called decomposition.
Assuming that we have taken the lowpass portion, we now have 3 sets of data, each corresponding to the same signal at frequencies 0-250 Hz, 250-500 Hz, 500-1000 Hz.
Then we take the lowpass portion again and pass it through low and high pass filters; we now have 4 sets of signals corresponding to 0-125 Hz, 125-250 Hz,250-500 Hz, and 500-1000 Hz. We continue like this until we have decomposed the signal to a pre-defined certain level. Then we have a bunch of signals, which actually represent the same signal, but all corresponding to different frequency bands. We know which signal corresponds to which frequency band, and if we put all of them together and plot them on a 3-D graph, we will have time in one axis, frequency in the second and amplitude in the third axis. This will show us which frequencies exist at which time ( there is an issue, called "uncertainty principle", which states that, we cannot exactly know what frequency exists at what time instance, but we can only know what frequency bands exist at what time intervals, more about this in the subsequent parts of this tutorial).
However, I still would like to explain it briefly:
The uncertainty principle, originally found and formulated by Heisenberg, states that, the momentum and the position of a moving particle cannot be known simultaneously. This applies to our subject as follows:
The frequency and time information of a signal at some certain point in the time-frequency plane cannot be known. In other words: We cannot know what spectral component exists at any given time instant. The best we can do is to investigate what spectral components exist at any given interval of time. This is a problem of resolution, and it is the main reason why researchers have switched to WT from STFT. STFT gives a fixed resolution at all times, whereas WT gives a variable resolution as follows:
Higher frequencies are better resolved in time, and lower frequencies are better resolved in frequency. This means that, a certain high frequency component can be located better in time (with less relative error) than a low frequency component. On the contrary, a low frequency component can be located better in frequency compared to high frequency component.
Take a look at the following grid:
        f ^
          |*******************************************         continuous
          |*  *  *  *  *  *  *  *  *  *  *  *  *  *  *         wavelet transform
          |*     *     *     *     *     *     *
          |*           *           *           *
          |*                       *
          --------------------------------------------> time
Interpret the above grid as follows: The top row shows that at higher frequencies we have more samples corresponding to smaller intervals of time. In other words, higher frequencies can be resolved better in time. The bottom row however, corresponds to low frequencies, and there are less number of points to characterize the signal, therefore, low frequencies are not resolved well in time.
        ^frequency
        |
        |
        |
        | *******************************************************
        |
        |
        |
        | *  *  *  *  *  *  *  *  *  *  *  *  *  *  *  *  *  *  *   discrete time
        |                                                           wavelet transform
        | *     *     *     *     *     *     *     *     *     *
        |
        | *           *           *           *           *
        | *                       *                       *
        |----------------------------------------------------------> time
In discrete time case, the time resolution of the signal works the same as above, but now, the frequency information has different resolutions at every stage too. Note that, lower frequencies are better resolved in frequency, where as higher frequencies are not. Note how the spacing between subsequent frequency components increase as frequency increases.
Below , are some examples of continuous wavelet transform: Let's take a sinusoidal signal, which has two different frequency components at two different times:
Note the low frequency portion first, and then the high frequency.
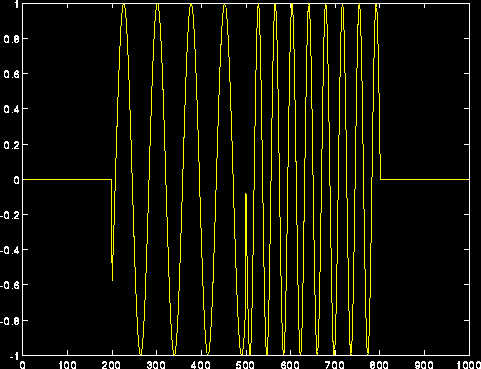
Figure 1.10
The continuous wavelet transform of the above signal:
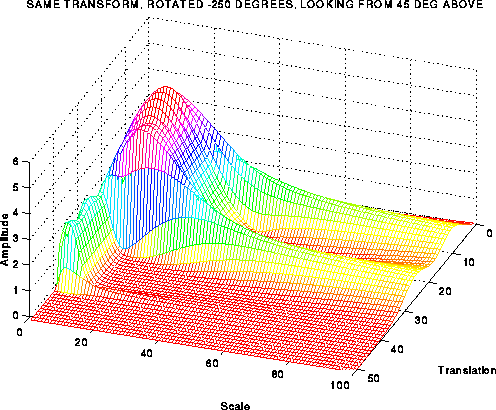
Figure 1.11
Note however, the frequency axis in these plots are labeled as scale . The concept of the scale will be made more clear in the subsequent sections, but it should be noted at this time that the scale is inverse of frequency. That is, high scales correspond to low frequencies, and low scales correspond to high frequencies. Consequently, the little peak in the plot corresponds to the high frequency components in the signal, and the large peak corresponds to low frequency components (which appear before the high frequency components in time) in the signal.
You might be puzzled from the frequency resolution shown in the plot, since it shows good frequency resolution at high frequencies. Note however that, it is the good scale resolution that looks good at high frequencies (low scales), and good scale resolution means poor frequency resolution and vice versa. More about this in Part II and III.
To Be Continued...
This concludes the first part of this tutorial, where I have tried to give a brief overview of signal processing, the Fourier transform and the wavelet transform.\
First written: November 1994
Revised: July 23, 1995
Second Edition: June 5 , 1996
All Rights Reserved. This tutorial is intended for educational purposes only. Unauthorized copying, duplicating and publishing is strictly prohibited.
Robi Polikar
Rowan University
Phone: (856) 256 5372
polikar@rowan.edu