Electrical Communications Systems
Course No. 0909-331-01
Spring 2005
Laboratory Project 2
AM and DSB-SC Modulation
and Detection
Objectives
This project has 2 parts. In Part 1,
you
will investigate the performance of the envelope detector. In Part 2,
you
will generate and detect AM and DSB-SC bandpass signals using the
LM1596/LM1496
Balanced Modulator-Demodulator.
In both parts, you will test the system with
single-tone
AM ( w and w/o added Gaussian noise) and multi-tone AM signals (w/o
added
noise).
Equipment and Software
- HP
33120A
Function Generator/Arbitrary Waveform Generator
- HP
54645A
Oscilloscope
- HP8591EM EMC Analyzer/ HP Infinium
Oscilloscope
/HP
54657A FFT Module
- 1N4148 Fast Switching Diode
- LM 613 Dual Operational Amplifier.
Download data-sheet.
- LM1596/LM1496 Balanced
Modulator-Demodulator
ICs. Download data-sheet.
- Assorted Resistors and Capacitors (based
on
design).
- PC speakers
- MATLAB
- Agilent IntuiLink Connectivity
Software
- Audio Player Software on PC
- CD with your favorite music!
Project Requirements
Part 1
- Design the envelope detector circuit
shown in
Figure 1. The design equation is fco = 1/(2pR1C1) where fco
is
the cut-off frequency of the low-pass filter R1C1
.
Cc is a coupling capacitor, chosen such that Cc >>
C1 . As initial design parameters, you can choose = 10
k-ohms and
= 0.001 microfarads, which provides a cut-off frequency of 15.9 kHz.
(As
part of the theory section in your report, you are expected to derive
this
design equation).
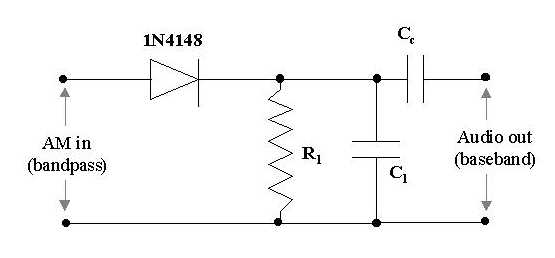
Figure 1: Envelope detector circuit.
Single-Tone AM Detection: No added Gaussian Noise
- Using the HP Arb. Function Generator,
generate
an AM wave with carrier frequency of 600 kHz (in the AM band) and
modulation frequency 2.5 kHz (single tone).
- Vary the modulation depth from 10% to
120%.
- For each modulation depth, observe
and
digitally capture the input and output waveforms.
- Perform a spectral analysis of the
input and
output waveforms. Observe the spectral components due to ripple and
harmonic
distortion.
- Listen to the output signal using the
PC speakers. Compare with the pure tone of the same frequency.
- Set the modulation index to an optimal
value
(max value for minimum distortion) and vary the modulating signal
frequency to determine the 3-dB bandwidth of the detector (value at
which the output signal falls to 0.707 of its maximum value).
- Experiment with varying the carrier
frequency
and/or cut-off frequency of the LPF.
Multi-Tone AM Detection: No added Gaussian Noise
- Figure 2 shows the overall block diagram for this part of the
lab project.
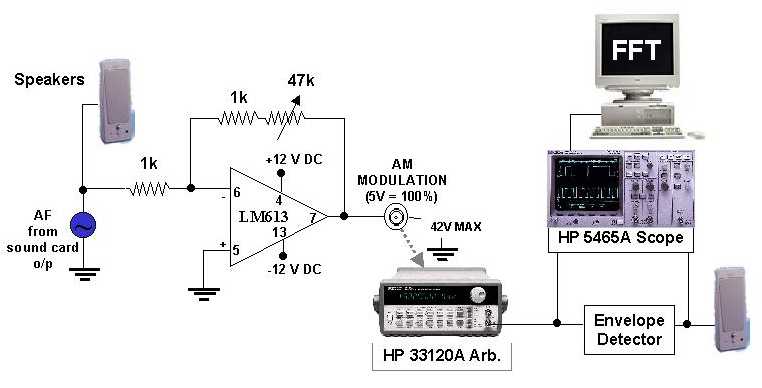
Figure 2: Multi-tone AM generation and detection.
- Obtain a multi-tone baseband signal by
playing
a CD on your PC and tapping into D/A converter output of the
sound card.
- Feed this baseband signal into the
external
AM modulating source input at the back of the HP 33120A Function
Generator.
- Choose a suitable carrier frequency (in
the
AM broadcast band) and generate an AM signal by choosing external
modulating
source in the HP 33120A menu.
- Observe the modulated signal on the oscilloscope. Vary the
modulation
depth by varying the gain of the operational amplifier.
- Apply the multi-tone AM signal to the input of the envelope
detector.
For each modulation depth:
- Observe, calculate the modulation depth
and digitally capture the input and output waveforms.
- Perform a spectral analysis of the
input and
output waveforms.
Single-Tone AM Detection: With added Gaussian Noise
- Repeat the single-tone AM detection
experiment
by digitally synthesizing single-tone AM signals with varying SNR.
Figure 3 shows the overall block diagram for this part of the lab
project.
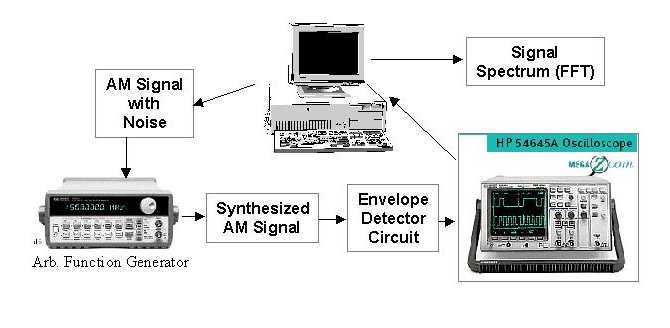
Figure 3: Block diagram of the approach for single-tone AM
detection with added Gaussian noise.
- At each stage, note your obervations and
conclusions.
Part 2
The obective is to observe (in time and
spectral domains) & listen as audio tones progresses along a
modulation-demodulation system, both in the presence and absence of
added Gaussian noise.
- Prelab: Download and print
out
the data-sheet for the
LM1596/LM1496
balanced modulator-demodulator.
- Implement the DSB-SC Modulator circuit
shown
in the data sheet (reproduced in Figure 4 below). Test the system
response
by feeding two audio-frequency tones to the input pins. Observe the
waveforms on the oscilloscope; listen using the speakers.
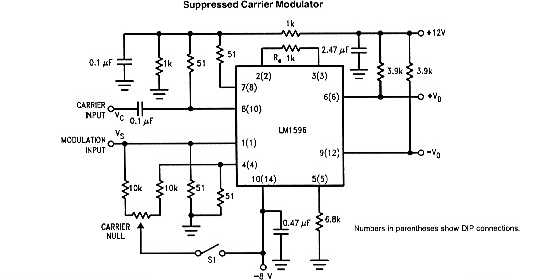
Figure 4: Application circuit from the LM1596/LM1496 data-sheet.
- Increase the carrier frequency input to the RF range (AM
broadcast
band) and observe the output waveforms. Vary the carrier null
potentiometer
setting to obtain standard AM and DSB-SC modulation (you may need to
replace
the two 10 k resistors feeding the potentiometer with a pair of 750 ohm
resistors to get appreciable carrier feedthrough). Observe the system
response both in the time and spectral domains (you need to perform a
signal capture followed
by an FFT operation to do this).
- Experiment with various carrier and modulation frequency
settings.
- Vary the modulating signal amplitude - calculate the
corresponding
changes in modulation index. Determine the spectral response.
- Repeat the experiment by mixing in a multi-tone modulating
signal
(generated as in Part 1).
- Implement the product detection circuit shown in the data-sheet
(reproduced
in Figure 5 below). Test the circuit by feeding in an externally
modulation
multi-tone AM signal from the arb (the block diagram for this part is
similar
to Figure 2; except that the envelope detector is replaced by the
LM1496
demodulator circuit). Observe and listen to the audio output.
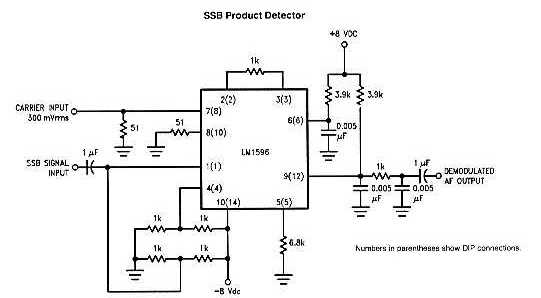
Figure 5: Application circuit from the LM1596/LM1496 data-sheet.
- Test the product detector circuit by feeding in digitally
synthesized
single-tone AM and DSB-SC signals with varying SNR. When does the
modulator
fail to detect the message signal?
- Link the modulator-demodulator circuits and observe signal
progression from input to output.
Required Reading
- Sections 4.11 - 4.13, 5.1 - 5.4 of
textbook.
- User's Guides for HP
33120A
Function Generator/Arbitrary Waveform Generator, HP
54645A
Oscilloscope and HP
54657A FFT Module
Click here for required lab project
report
format.
Click here for suggestions for a
good lab
report.


