PROCEDURE:
1) Capture a live Daphnia and place it in a depression slide with a drop of water from the culture jar. Next observe the anatomy of the Daphnia (a chart can be found on the cart). The most obvious structure is the eye. The brain is the light colored organ lying above the eye. Two pairs of antennae protrude from the head. These are used for locomotion and to sense the environment. Inside the exoskeleton are 5 pairs of legs. Comb-like gills are attached to some of the legs. When the legs kick forward they bring a stream of water across the gills and wash bits of food up to the mouth, which lies just beneath the beak. From the mouth the esophagus runs up into the head and then down into the body, where it widens into the stomach, which connects to the intestine. The heart lies in the upper part of the Daphnia. In females a large brood chamber is located behind the heart. Usually it will contain eggs, but occasionally a fortunate student will find it filled with baby Daphnia.
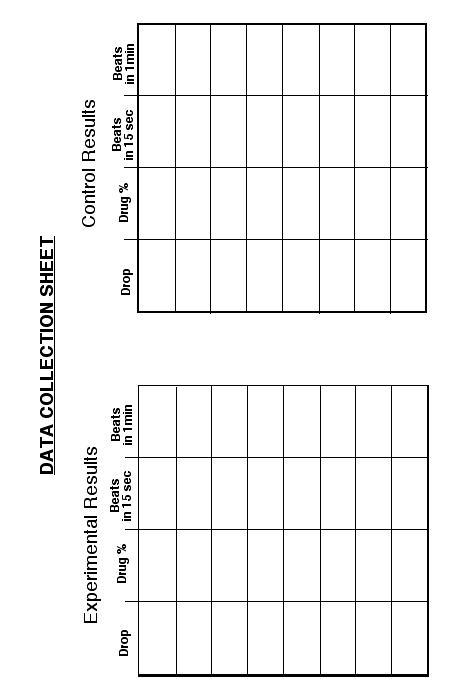
2) Begin to count the number of heartbeats for 15 seconds. The rate in a healthy Daphnia will be very rapid around 2-5 beats per second. Record your data respectfully on the Data Collection Sheet. This will be the blank on your sheet. First label the drop contents followed by the percent of that drug and then the number of beats that occurred during a 15 second time period. Then calculate the beats per minute. The simplest way to do this is to use ratios. For example, if you count 10 beats in 15 seconds the calculation is as follows: X/60=10/15 There for X=600/15, or 40 beats/minute. In other words you multiply the number of beats by 60 seconds. Take that number and divide by 15 seconds. This will give you the number of beats that occur in 1 minute. Now remove the water by placing the edge of a tissue (kimwipe) in the depression of the slide and wicking the water away.
3) Place 1 drop of a 0.5% caffeine solution on the Daphnia. Wait 1 minute and then begin to count the heart beats. Remember to record your results on the data sheet.
4) Using the same procedure, monitor the effects of 1.0% and 2.0% caffeine solutions. Be sure to remove the drug prior to testing the other drugs. Record your results on the data sheet.
5) After completing the caffeine series, try the second set of drugs. This time use varied concentrations of ethanol instead of caffeine. Again record your results on your data sheet.
6) Having administered all of the drugs, it is time to return your test subject (Daphnia) to the recovery tank located on the cart.
Even if you performed all of your experiments very carefully, you cannot be certain that the effect you see is due to the drugs. Perhaps the change in heartbeat rate is caused by the heat of the microscope light. The removal or addition of the various test solutions may have an impact on your test subject. This is why we will perform a control experiment, otherwise your data is meaningless.
THE CONTROL EXPERIMENT:
The control procedure must be performed exactly as the experimental procedure. The only difference is the variable is omitted. In this instance that means that the alcohol and caffeine are not added. Again place a Daphnia on a slide. Using the same time intervals and following the same procedure, substitute 1 drop of water for another. Record the heart rates on the worksheet.
COLLECTING DATA:
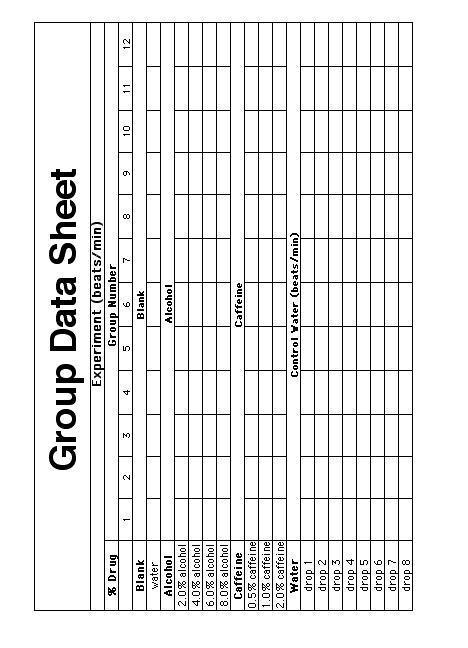
You will occasionally perform an experiment that does not work. This does not necessarily mean that you have disproved the hypothesis. It does mean that the experiment must be repeated so that variations in technique or in an individual organism's response can be put into perspective. For example, having used a different Daphnia for the control procedure, how can you be sure that its responses compare adequately to the Daphnia that you used for the alcohol and caffeine procedures? The answer is to repeat the experiment many times. Instead of you repeating the experiment several times in order to get some good data, collect your class data. Then individual results can be compared to a larger sample size. Use the Group Data Collection Sheet included in this write up.
ANALYSIS OF THE DATA:
Results from experiments must be presented in a clear, scientific way. The first lab of the year is the time to learn this procedure. If tables and graphs are well constructed, they can provide a concise summary and allow the reader to see at a glance the pertinent results of the experiment. Remember, a picture is worth a thousand words.
INTERPRETATIONS AND CONCLUSIONS:
One of the most important features of scientific inquiry is the exchange and sharing of information. Scientists publish experimental results to make them known to others and include their interpretations of what those results mean. When writing a discussion of an experiment be careful not to let preconceived notions or personal convictions interfere with an objective analysis.
FURTHER EXPERIMENTS:
The scientific method is a continuing cycle of questions and answers. A good experiment not only answers the question that was originally posed, but also gives rise to further questions that may lend themselves to additional experiments. This is how scientists begin to understand a particular system.
CLEANING UP:
This is the final step in every laboratory. Return all materials and solutions then clean up your work area as directed by your instructor. Always wipe your area down with a paper towel. Remember that there will be other classes using the same lab space to perform their experiments. Please remember to leave your area clean. Some lab solutions can stain clothes, damage books and perhaps bodily harm so please be considerate.
DAPHNIA LAB QUESTIONS ......CLICK
HERE![]()
FOR A FULL PRINT OUT OF THIS
LAB ......CLICK HERE ![]()
BACK TO THE LAB INDEX .....CLICK
HERE ![]()
![]()