Stability
General Description
There is a strong interrelationship between success and failure in engineering. When engineers properly anticipate the possible failure modes of a structure or system, they can obviate them by design. This game actually explores such nature of design – success through failure, providing students a virtual environment to build bridges with constraints. In particular, students will be able to (a) use CAD software Inventor imported into the game interface for 3D bridge design, (b) analyze the structure impact of gravity and other loading effects on a bridge and (c) visualize bridge collapses resulting from their impropriate choices of bridge spans, materials, and/or forms with a given gravity loading condition. Connecting those failures to the real tragedies in the world, such as Minneapolis bridge collapse in 2007 and Tacoma Narrow bridge collapse in 1940, brings professional ethics into the game as well. Introducing a vision of engineers tackling real life problems to impact the quality of life will further generate tremendous enthusiasm and attract more people, especially underrepresented groups, into engineering.
Problem Statement
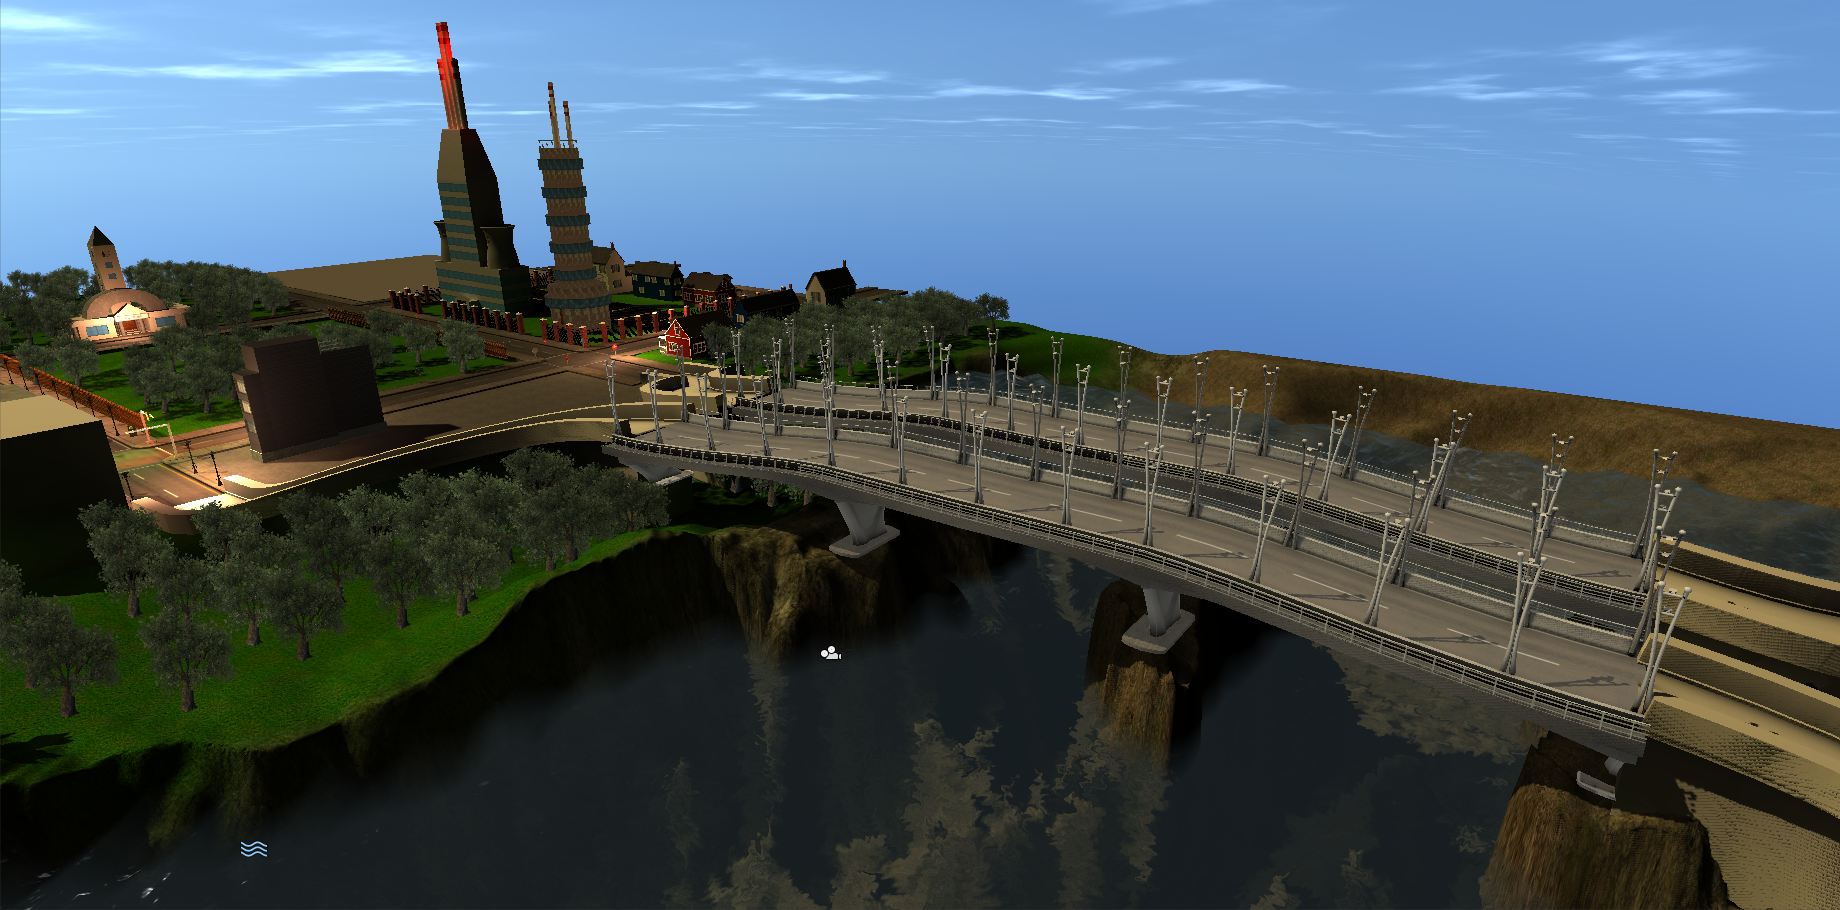
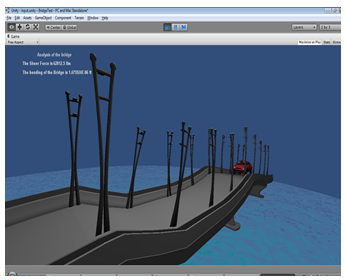
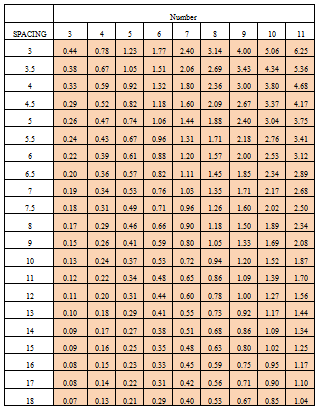
A busy bridge is presented at the beginning of this game module and players are invited to conduct a stability analysis of the bridge to estimate its lifetime. Players navigate between two screens to complete this task, one where they must provide mechanical and structural specifications of the bridge, average amount of traffic per day, and climate situation as inputs. The combination of inputs used by the player will determine the kinds of bridges the player interacts with, analyzes and draws conclusions from. The other screen is an analysis and mitigation screen seen in the second image on the right where a simulation of the bridge using the player’s input occurs allowing a visualization of deflection on the bridge. The analysis also retrieves information about the bridge such as the amount of force and moments exerted on the bridge and the area of beams required at the center and ends to mitigate bridge bending. A table is given to the students as seen in the third image on the right containing the required area of beams in the cells, number of beams in the column values, and spacing of the beams in the row values. The student has to try different configurations of the bridge and make observations and deductions based off the bridge analysis when changing one or more parameters. The student must then make an educated guess for the optimal decision for the best alleviation option for the bridge.


